GC Explorer
The Guardian Connector Explorer (GC Explorer) is a web-based data visualization tool that transforms your community's tabular data into interactive maps, galleries, and dashboards. Built specifically for Guardian Connector, it connects directly to your PostgreSQL database to display data collected from tools like CoMapeo, KoboToolbox, and other data collection platforms.
🗺️ Available Views
📍 Map View: Visualize your geospatial data on an interactive map with pop-up information panels and embedded media attachments.
📸 Gallery View: Browse through photo, audio, and video content collected in the field, organized by date or location.
⚠️ Alerts Dashboard: Monitor environmental changes and threats with change detection alerts and before-and-after satellite imagery.
🔄 Data Integration
GC Explorer automatically works with data from:
- CoMapeo: Community mapping and observation data
- KoboToolbox/ODK: Survey responses and forms
- Environmental Alerts: Satellite change detection data
- Custom Data Sources: Any PostgreSQL-compatible tabular data
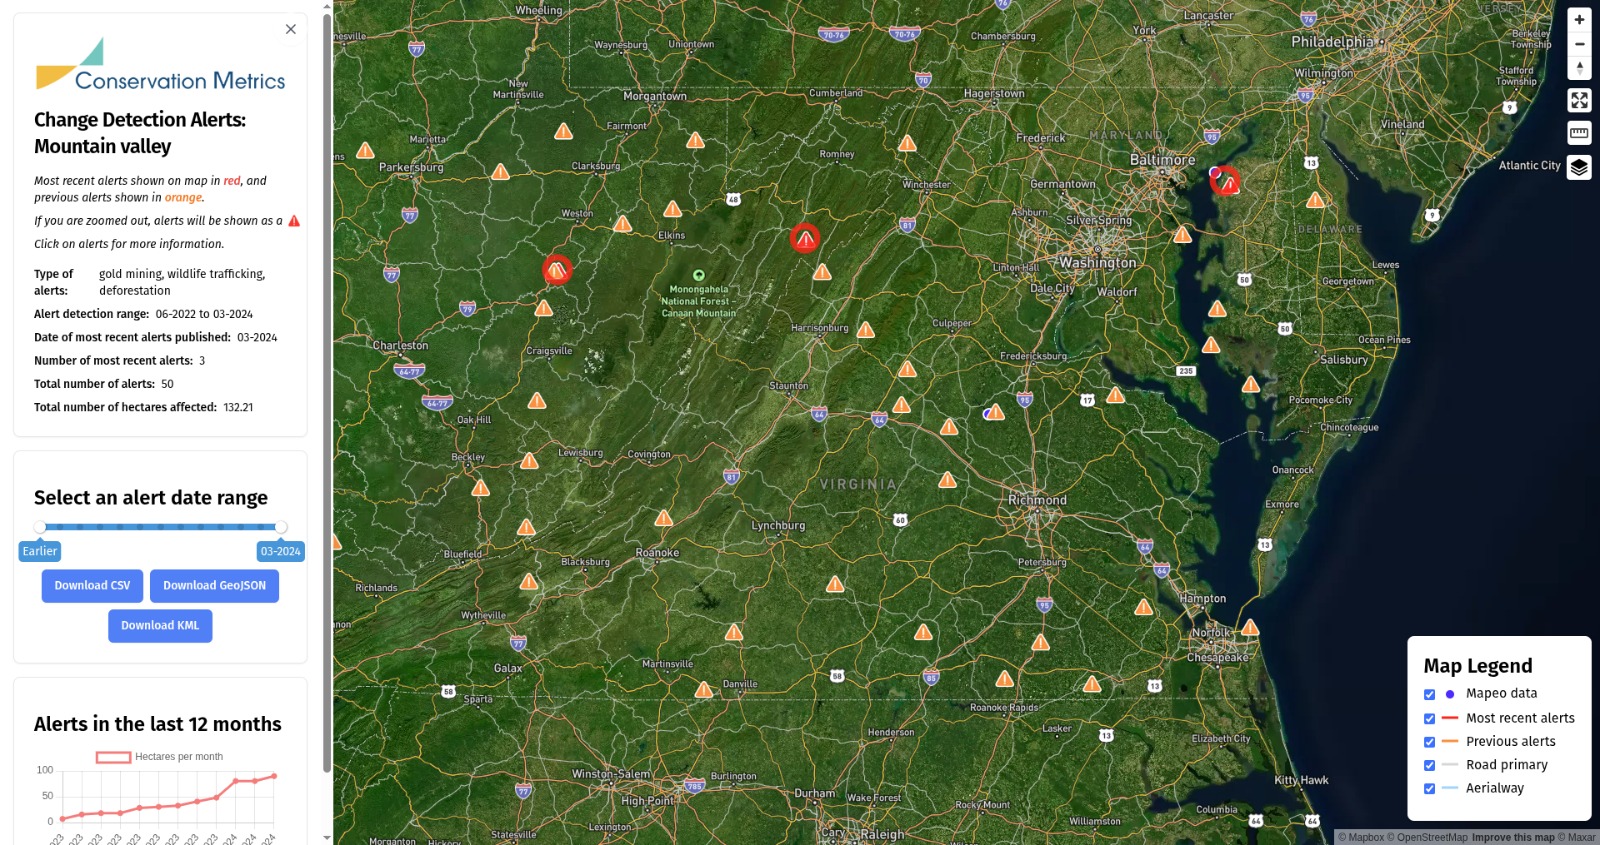 Example of an Alerts Dashboard in GC Explorer
GC Explorer transforms raw data into accessible, visual formats that help communities understand, share, and act on their collected information.
📤 Exporting Data
GC Explorer allows you to export data directly from the Map View into a variety of formats for use in other tools and workflows.
Currently supported export formats include:
- CSV: Export your data in a tabular format for spreadsheets, databases, or further analysis.
- GeoJSON: Export geospatial data in a modern open format widely supported by GIS tools and web mapping applications.
- KML: Export geospatial data for use in applications such as Google Earth and other mapping platforms.
These exports make it easy to continue working with your data outside of GC Explorer using the tools and formats that best fit your community’s needs.
Once you have exported your data as CSV, GeoJSON, or KML, it is possible to convert it into many other GIS-compatible formats if needed.
Some commonly requested formats include:
- Shapefile (.shp)
- GeoPackage (.gpkg)
- File Geodatabase (.gdb)
Both QGIS and ArcGIS support importing GeoJSON and KML data and exporting it into these additional formats.
While shapefiles are widely compatible, they also have important limitations, including:
- A maximum 10-character limit for column names
- Limited support for non-Latin character encoding
- Restrictions on field types and data structure complexity
If these limitations affect your workflow, it is generally recommended to use GeoPackage or File Geodatabase formats instead.
In ArcGIS, CSV files containing coordinate information can also be loaded directly using the "Add XY Data" feature.